Adding Areas / Polygons
Choose from the any of the area / polygon icons ![]()
![]() to draw area graphics on your map.
to draw area graphics on your map.
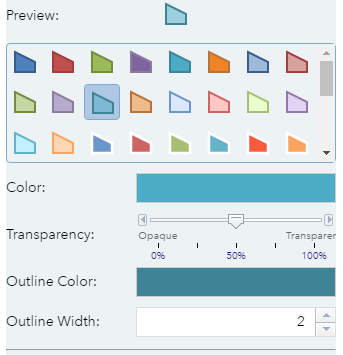
Select a template or choose from the fill and outline colour, outline width and transparency settings.
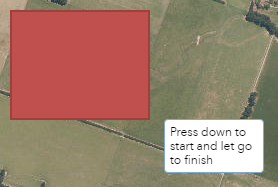
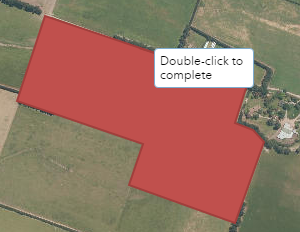
Click on the map to start drawing.
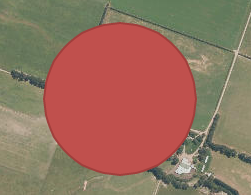
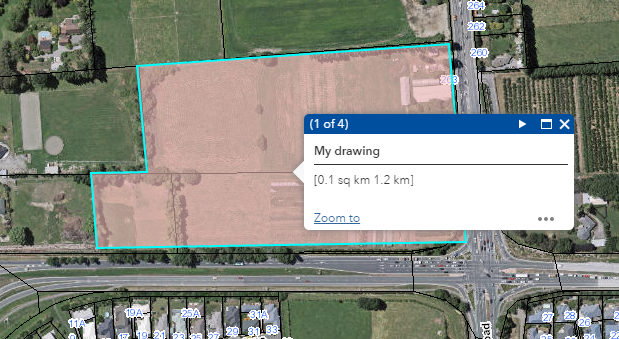
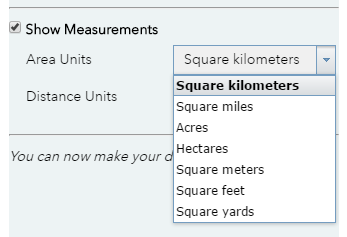
Check the show measurements tick box to display area measurements on top of the graphic. You can choose from a variety of area and distance units.
Measurements can also be viewed by selecting the graphic in your map and viewing the popup that appears